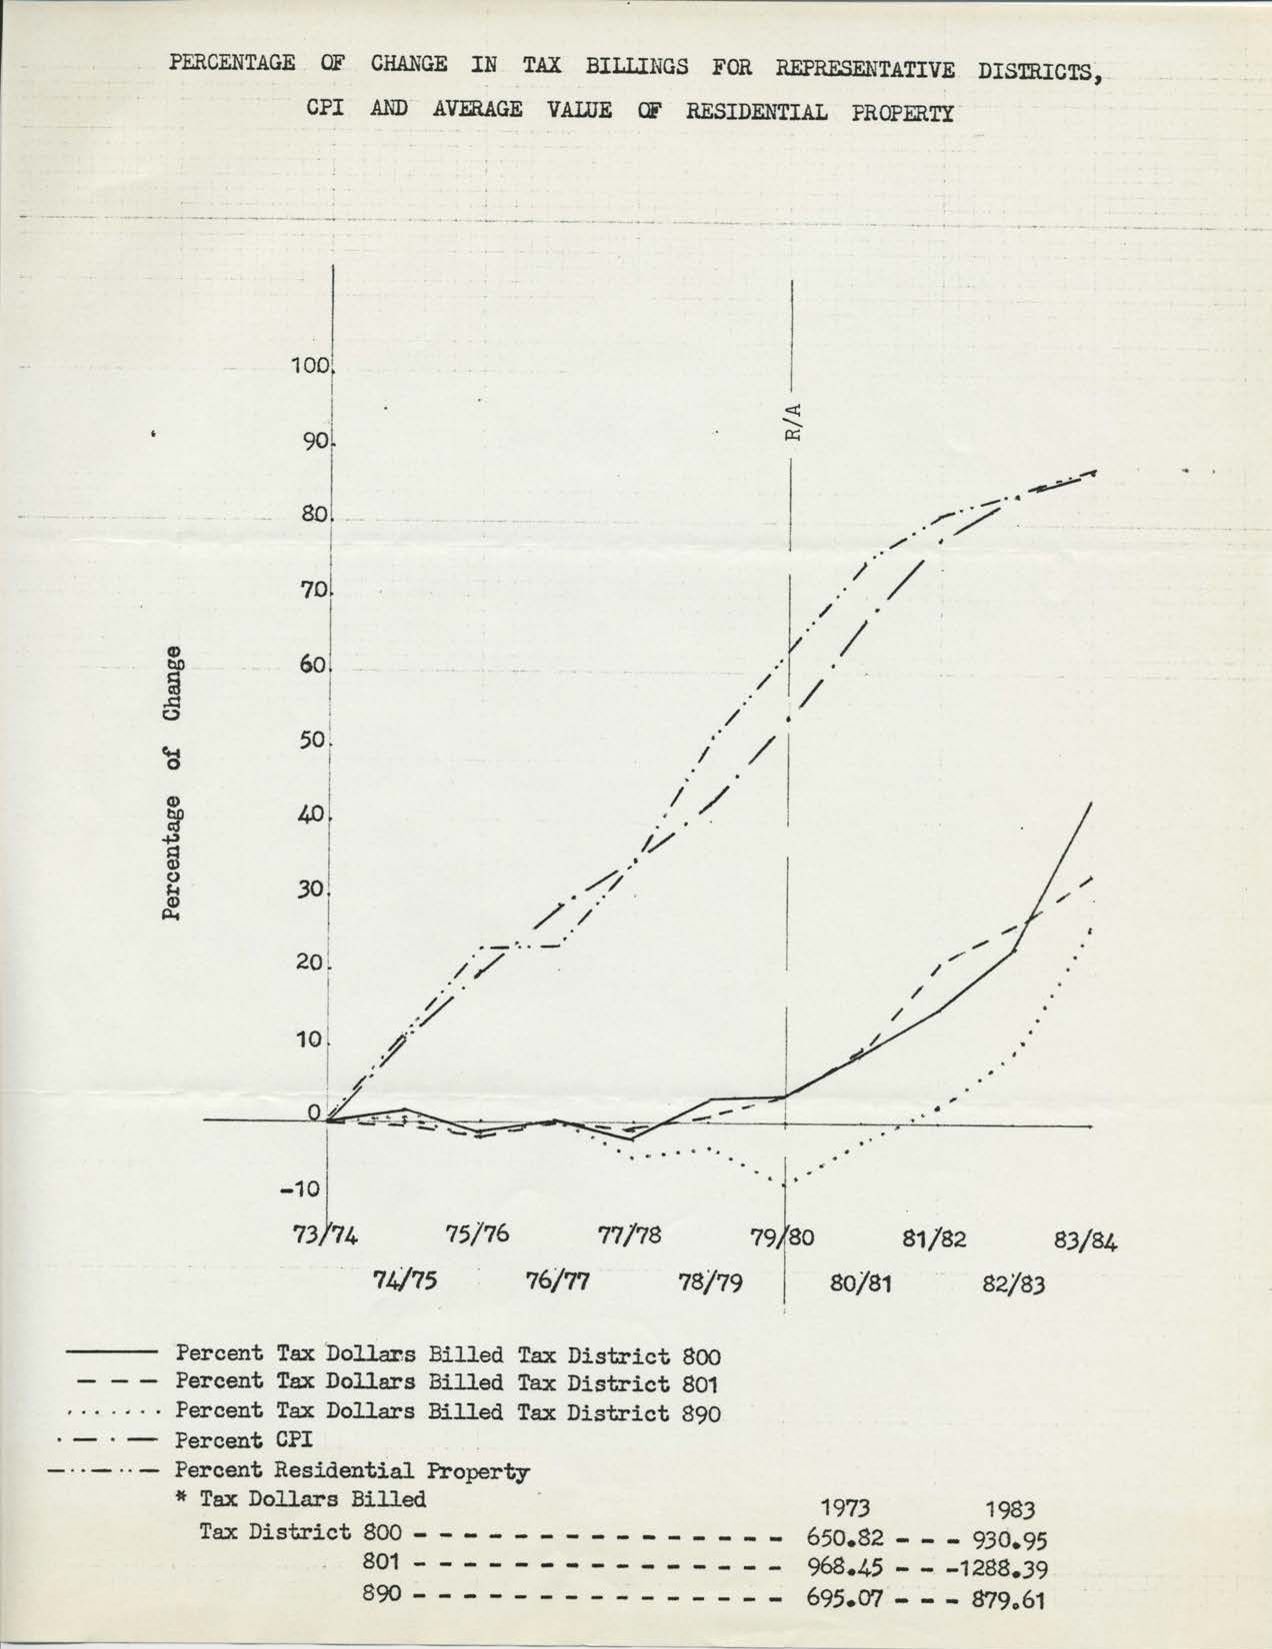
Percentage of Change in Tax Billings for Representative Districts, CPI and Average Value of Residential Property
Graph indicating percentage of change in tax billings for representative Districts, CPI and average value of residential property.
Type
Subjects